In this post, you will learn how to read an excel file using Pandas Library for python. We are going to use a real-world dataset as an example.
If still don’t know what Pandas Library for Python is, you can check this post.
When analyzing data, you can be tempted just to get data and try to find some useful information from it without doing a background study of the data. This is a common mistake that sometimes programmers make.
The right way to start a data analysis project is first to understand the data. You cannot analyze data without the data and without understanding the structure of it and what it describes. In other words, you first have to get familiar with the data for you to analyze it.
For this article, I choose a data set from Pew Research Center. Let’s first analyze the nature of the data set and then, we will see how to load it using Pandas Library for python.
Dataset
The name of this data set is “Teens and Tech Survey 2018” and you can download it here.
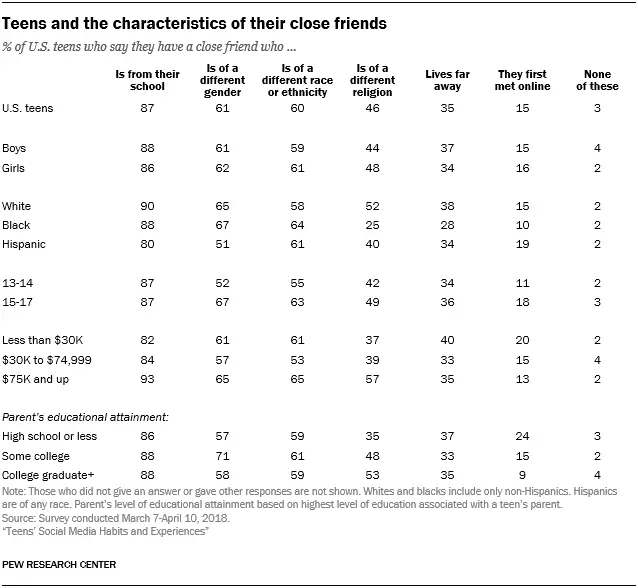
This is the part of the data contained in the dataset. As you can see from the table above, there is demographic information of U.S. teens and information about their friends.
An important step even before trying to read the dataset is to understand the structure and what information we can find in the dataset.
Reading the file using pandas library for python
For you to read an excel file, you will need to install the optional dependency openpyxl. You can do it using pip.
Here is the initial code you can use to read the file.
import pandas as pd
if __name__ == "__main__":
excel_file = "March 7-April 10, 2018 - Teens and Tech Survey - CSV.xlsx"
xlsx = pd.ExcelFile(excel_file)
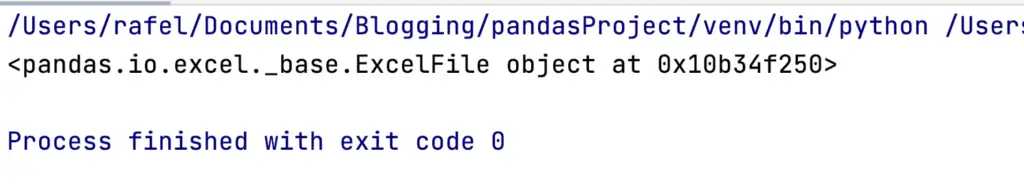
print (xlsx)If the file was read, you should see something like this after you execute the code above.
Let’s print the dataset in a format that we can understand.
We can create a table by reading a specific sheet. If you are not sure what are the sheet names pandas is reading you can use the following line of code:
print (xlsx_file.sheet_names)Let’s see how the table for the data looks like.
import pandas as pd

if __name__ == "__main__":
    excel_file = "March 7-April 10, 2018 - Teens and Tech Survey - CSV.xlsx"
    xlsx_file = pd.ExcelFile(excel_file)
    table = xlsx_file.parse('March 7-April 10, 2018 - Teens ') #Name of the sheet

    print (table)
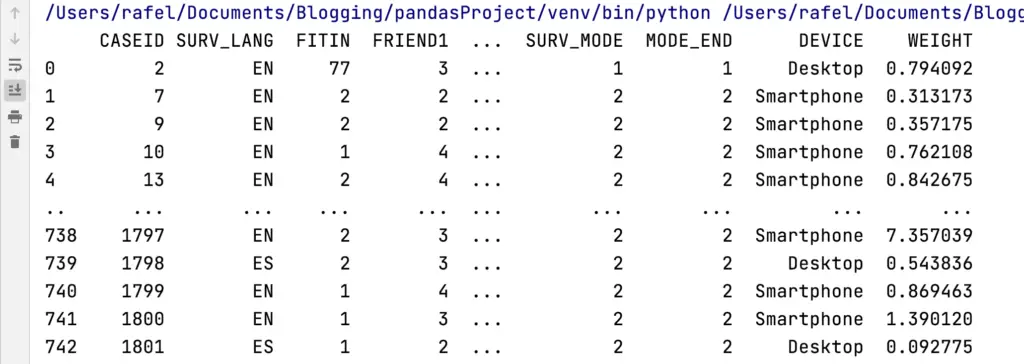
In this case, the table is too big so you will see that some columns and rows are missing.
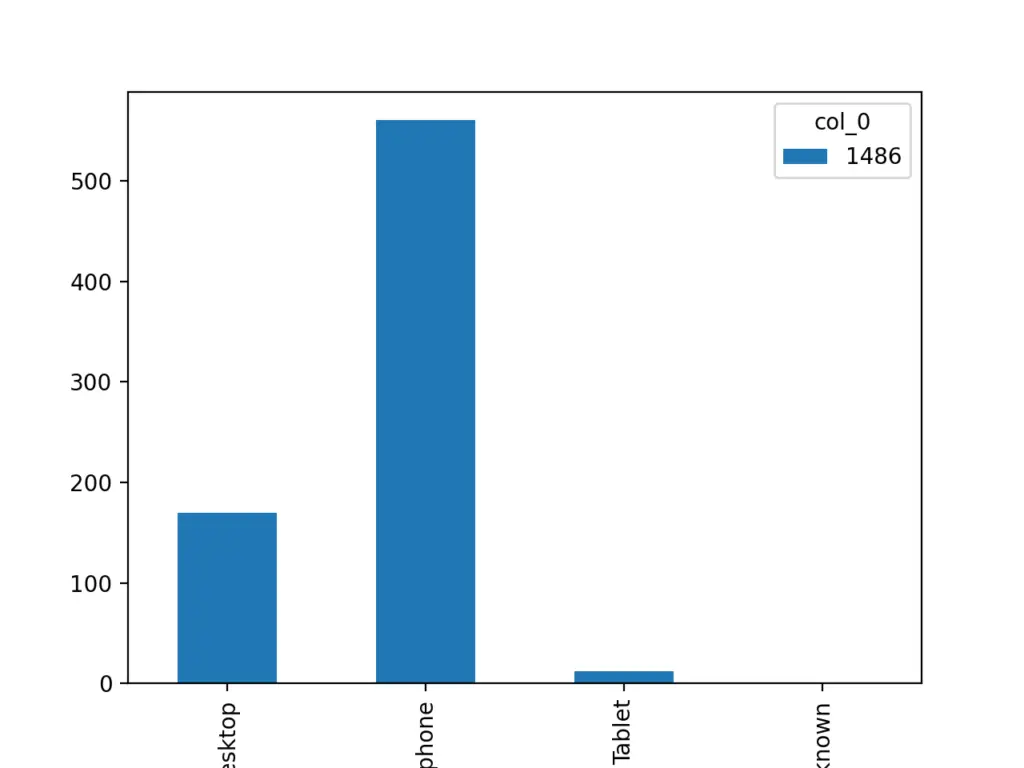
Just as an example of what we can do with this data, let’s find out what is the percentage of teens that are using Smartphones or Desktop computers.
import pandas as pd
import matplotlib.pyplot as plt


if __name__ == "__main__":
    excel_file = "March 7-April 10, 2018 - Teens and Tech Survey - CSV.xlsx"
    xlsx_file = pd.ExcelFile(excel_file)
    table = xlsx_file.parse('March 7-April 10, 2018 - Teens ') #Name of the sheet
    df = pd.DataFrame(table, columns=['CASEID', 'DEVICE'])
    devices = pd.crosstab(df.DEVICE, df.size)
    devices.plot(kind='bar')
    plt.show()
Summary
In this post, we created an example that shows how to read an excel file with panda’s library.
The dataset on this file is from real-world research related to Teens’ Social Media Habits and Experiences.
The next step is to analyze this data to find out useful information.
H@ppy coding!